Welcome to
Pinellas Park
Stands out as a commercially versatile submarket with a large industrial footprint and active retail nodes along key arterial corridors.
Pinellas Park is a highly functional and commercially versatile submarket within the greater Tampa Bay region. Strategically positioned between St. Petersburg and Clearwater, it benefits from immediate access to major regional corridors including US-19 and I-275, making it a practical hub for industrial users, service operators, and value-driven retail tenants. The submarket’s affordability relative to nearby coastal areas continues to attract a wide range of occupiers seeking operational efficiency without sacrificing regional connectivity.
The commercial landscape in Pinellas Park is defined by a strong industrial base complemented by active neighborhood retail nodes concentrated along key arterial corridors. Its zoning mix and established industrial parks support a steady pipeline of leasing activity, particularly from logistics, light manufacturing, contractor services, and storage-oriented users.
Industrial & Logistics Overview
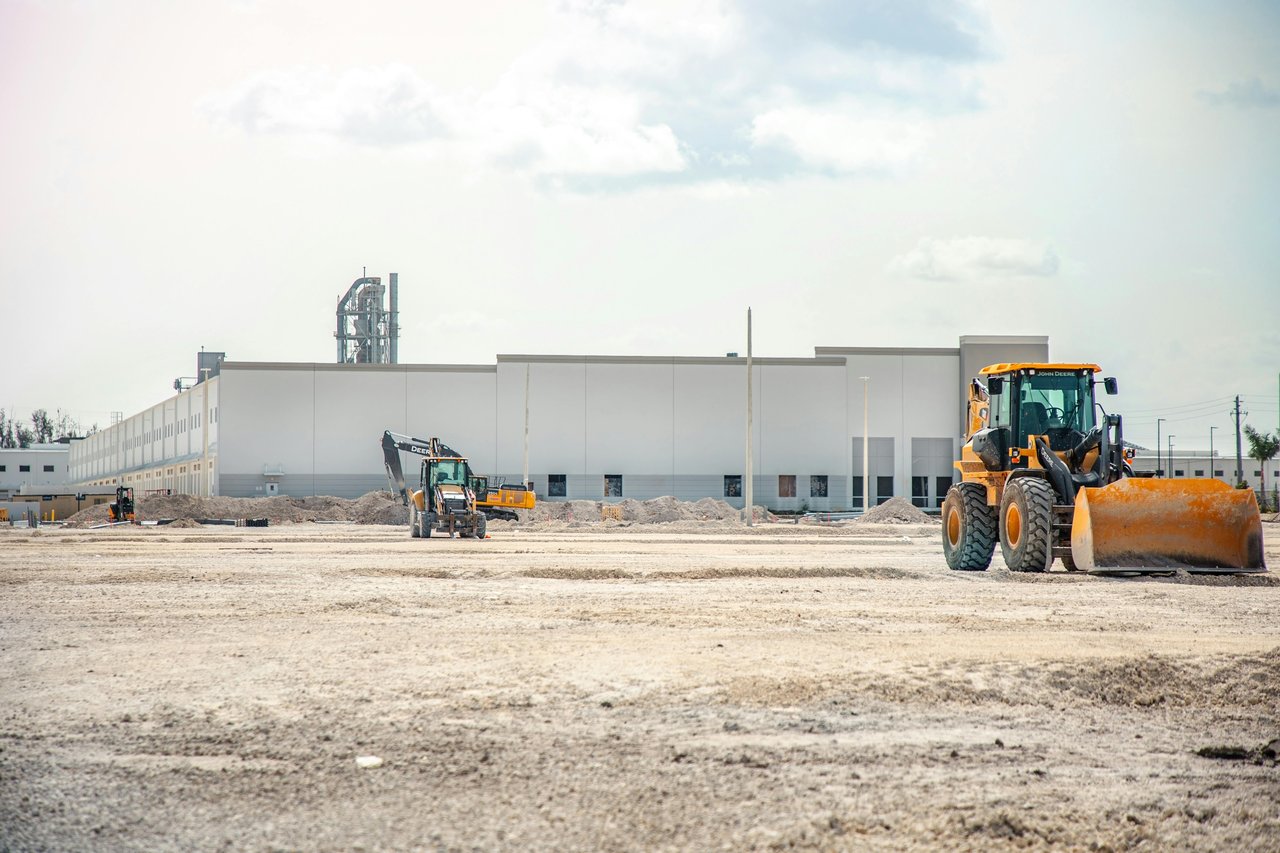
Industrial dominates much of the available commercial inventory in Pinellas Park, with approximately 1.3 million square feet of space currently available across various building types, including flex, warehouse, and small-bay industrial. Demand is driven by tenants seeking cost-effective alternatives to tighter and more expensive submarkets closer to the urban core. The area is particularly well-suited for last-mile distribution, service fleets, and light production users that benefit from central positioning within Pinellas County and efficient highway access.
Clear connectivity to regional transportation routes allows businesses to efficiently serve the broader Tampa Bay population, reinforcing the submarket’s role as a practical logistics and operations hub.
Retail Market Overview
Retail activity in Pinellas Park is primarily concentrated along high-visibility corridors where daily traffic and residential density support consistent demand. Lease rates generally remain competitive compared to coastal submarkets, typically averaging in the ~$16–$22 PSF range depending on location, condition, and frontage. Tenants in this area tend to be service-oriented and convenience-driven, including automotive services, quick-service dining, personal care, and neighborhood retail concepts.
While not a tourism-driven retail environment, the submarket benefits from strong local population support and steady consumer demand, which helps stabilize occupancy and sustain long-term tenancy.
Investment & Development Characteristics
Pinellas Park continues to appeal to investors and occupiers seeking value within the Tampa Bay commercial ecosystem. Industrial assets in particular tend to perform well due to limited new supply and consistent demand from local operators. Retail assets along primary corridors maintain stability through necessity-based tenant mixes, while redevelopment opportunities exist in older strip centers and underutilized parcels.
Best Suited For
Pinellas Park is especially well-positioned for:
Overall, Pinellas Park offers a balanced combination of affordability, accessibility, and functional commercial inventory, making it one of the more practical and dependable industrial-retail submarkets within the Tampa Bay region.

110 N. 11th St. Suite 209, Tampa, FL 33602
110 N. 11th St. Suite 209, Tampa, FL 33602